If you don't see the question or answer that you are looking for, you are more than welcome to click the helpdesk button.
We will aim to answer all your questions within 24 hours. Feel free to ask as many as you want!
If you are having problems with logging in there are a few reasons as to why.
Firstly ask if any of your team members have recently changed the password.
If not, try using a different browser to login, such as Microsoft Edge, Mozilla Firefox, Safari etc.
If you are still unable to login, contact the helpdesk, by either clicking this link, or the button at the top of the page. We will then be happy to reset the password for you.
1. Log in via a different web-browser (Mozilla Firefox, Microsoft Edge, Safari etc.)
Or
2. Deleting your browser-cookies. Go to your browser-settings and search for the option to delete your cookies, it is sometimes hidden under delete browser history. Close down you browser and log back in.
If you are unable to upload a picture or video to the simulation, it may be due to a number of different reasons.
1. If you are trying to upload a picture to the simulation, please make sure that the picture is in the correct form of .png.
2. If you are still having problems, but more specifically with the upload of a logo, the resolution could be the issue, a resolution 250px x 250px.
3. Finally regarding videos, if you have tried to enter a YouTube link, this could be the issue, instead try uploading the video to Vimeo and using this link instead.
If you are still having issues, then let us know at the helpdesk by either clicking this link or the button at the top of the page.
If you are struggling to use and know where to start in the Phone Ventures Simulation. We have a useful video that will guide in what each aspects of the simulations are used for and where to start.
This problem often refers to your inventory management system. First go to results then inventory and select the country where you are experiencing a large amount of “no sales”. Take a look at the graph or the table to see your demand numbers each week, as well as seeing what inventory levels you have as well in stock. You ideally always want to have your inventory level above the demand levels. To do this you may need to adjust your automatic order limits in the country where you are having problems. To do this head on over to decisions, then countries, select the country you want to adjust your inventory levels and scroll down to the bottom of the page.
To explain the Automatic Inventory ordering system let me use the example below:
Let's say we select the slow 'Speednet' as our Distributor (6 weeks delivery time):

And we had set our automatic order levels like this:
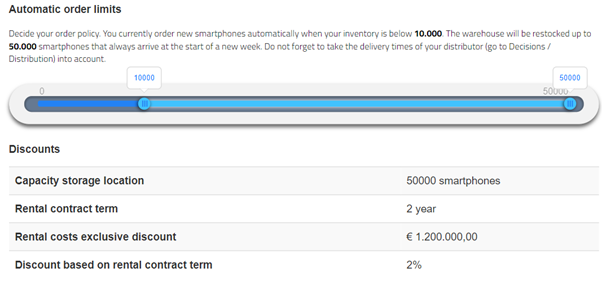
In this scenario, you would not order any new inventory until the inventory level drops below 10.000 phones in a certain week in this country.
Let's say in a certain week your inventory dropped from 11.000 to 9.000, you would then order 41.000 phones, but they will be delivered in 6 weeks time.
The issue that your team may be having is that you have either set your reorder limit too low, as well as your order high limit too low, so you may need to increase both factors.
In the first rounds we would advise your team to select the faster distributors as you do not have a lot of experience yet with the weekly demands yet.
Unfortunately, there is no way for you to download your previous rounds decisions, however you can see the results of previous rounds, which you could use to deduce your previous rounds decisions.
There is only one way where you can find how your decisions are affecting and that is using the analysis tool. Once you have selected analysis, click market, then select the segment that you are in, where it will then bring you to a page with some drop down boxes, which include “core score” and “multipliers on core score”.
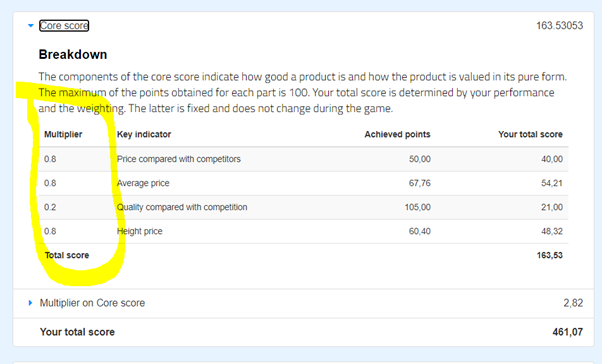
• The multipliers as in the picture below are fixed and tells you what customers in this customer segment tend to find important. For the Price segment (as in the picture below), you can see that the price of your phone is 12 times as influential on demand as the quality of your product. (2.4/2.6) while for the quality segment these multipliers will be more focused on quality (2.0/2.6) points are for quality).
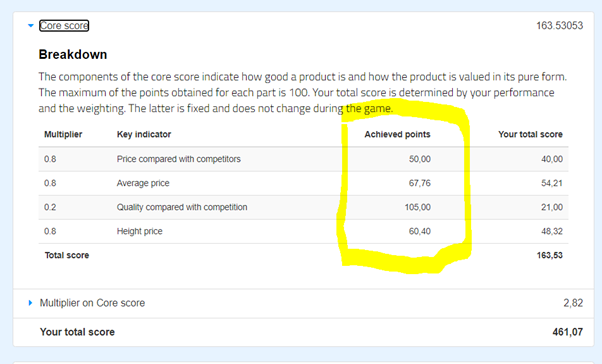
The achieved points as in the picture below indicate what the market thinks of your prices and product quality. A score of 100 is the maximum (except when compared to competition 105 max).
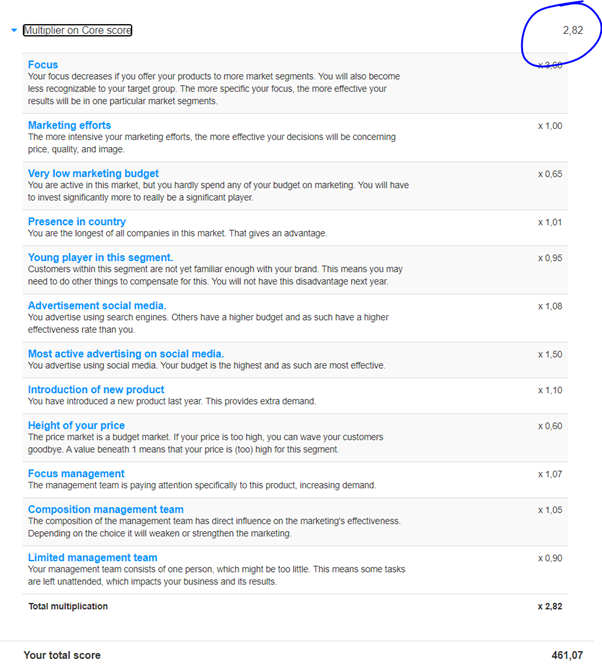
Your core score multiplied by your multiplier as in the picture below will lead to your total score for the price segment in Malaysia. Any multiplier that is below 1, is negative (lowers your multiplier on core score). You should try to get raise all of these multipliers to at least 1.0, where by all these multipliers are linked to the decisions that you have made. If you have a positive multiplier of 1 and above, that factor is providing you with an increase in demand.
There is often a couple of reason as to why your remuneration costs maybe high. But there are 3 different groups of employees that you need to keep in mind when calculating or looking at remuneration. 1, is your headquarters employees who you can hire in decisions>HR. 2, is the local employees that are automatically hired based on demand in your market. 3, external employees who are automatically hired if the workload for your headquarters staff is too much.
1. Headquarter staff: they take care of a number of tasks. Depending on many decisions in the game (company structure, their efficiency, time allowed for training, entering new countries, etc.), their workload might increase or decrease. You will have to analyse how well your HQ staff is handling the workload at Results>staff. If you do not hire enough employees for your HQ, external employees will have to do the work, they would be hired automatically and are much more expensive. When entering a new countries, the workload increases by quite a lot, the increase in workload in FTE's (full time employees) is mentioned on the page of the country.
2. Local employees are the cause of most of your remuneration costs, they are hired automatically based on the following formula:
(Your sales numbers in a country / Productivity Local employee for that country + number of base staff for that country = number of local employees automatically hired).
If you enter the US (see image below), the workload for your HQ will increase by 20 (FTE = Full time Employee), thus you should hire 20 extra employees at Decisions>HR.
You should always track your staff results to see if you are hiring external employees. Because the workload increase might be higher than 20 FTE's due to time allowed for training or huge number of sales.
You would automatically hire 25 additional Local employees, even if you don't sell any phones. If you sell 1 or 1050 phones is the US, you will hire 26 Local employees and if you sell 1051-2099 phones in the US you would hire 27 local employees (automatically)
3. As mentioned in the headquarter staff, external employees are automatically hired when the workload for your HQ staff is too much. Take a look at the staff results to see how many external employees you are hiring as that will tell you how many more HQ you may need to hire. This is because external staff are twice as expensive as your HQ staff that you hire, therefore they can significantly add to your costs.
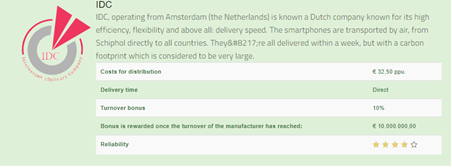
The PPu stands for price per unit. As for the example below, you would pay 32,50 distribution costs per phone.
If your total sales reach (10.000.000 / 32,5 = 307.692) in a year, you will get a 10% discount on the 10.000.000 distribution costs. If you sell 1 phone more, you would get a 10% discount on the 10.000.032,5 Distribution costs.
If you are not sure where to start in the Sneakers Start-Up Simulation, take a look at our instructional videos. It will guide you which direction you should head in, as well as explain key elements of the simulation.
Using Fast Delivery as the example below, you would pay 8.50 euros in distribution costs per pair of sneakers

If your total sales reach (1,000,000 / 8.50 = 117,647 units) in a year, you will get a 2% discount on the 1,000,000 distribution costs. If you sell 1 set of sneakers more, you would get a 2% discount on the 1,000,008.5 Distribution costs.
Only with the price per click (SEO) You are bidding for clicks against your competition on a search engine like Google. So just like with your selling price, your competitions's decisions influence how successful the price you set (pay) will be.
For the advertisements on social media you pay a certain amount for the social media network to display your ads that month.
So for the social network advertisements monthly budget you would pay a fixed amount of money per month so 12 times in the year.The price per click only exists with search engines (like Google), which will put you higher in its search results if you bid high compared to your competition. This price per click is max-ed out at 20.000 customer clicks. So if you set the price per click at 10 Pounds you have a decent chance of having 200.000 in costs (max).
The price per click you pay varies greatly in the real world as well as in the simulation. It is true that many technology firms in real life spend around 5 euro's on a single click, or even 50 Euro’s these are however extreme numbers, only very big companies with high margins can pay. I would say, I rarely see numbers above 10 in the simulation for price per click.
To set your budget, think about how it fits your strategy. Are you a product-leader with already high costs, but also high margins or are you a cost leader, that wants to keep it's costs as low as possible?
Also, compare the costs per click (multiplied by 20.000) to your other marketing budgets, would you be able to explain this difference in costs to your tutor? Where do you want to focus your investments on, and what investments are going to give you the highest returns?
There is only one reason as to why you may have received 0 points in a round, while at the same time you had reached the targets that you have set. The reason being that your team is in a negative equity position.
A negative equity position refers to the Owners Equity in the balance sheet. If the total owners equity is in a negative position you will receive 0 points. It is often the case that a team's reserves are in the negative, which can occur after spending years with a negative profit margin.
If you are unsure as to how you to start the Prosim Advanced Simulation. Take a look at our instructional video and what aspects to look at first, as well talking about important elements in the simulation.
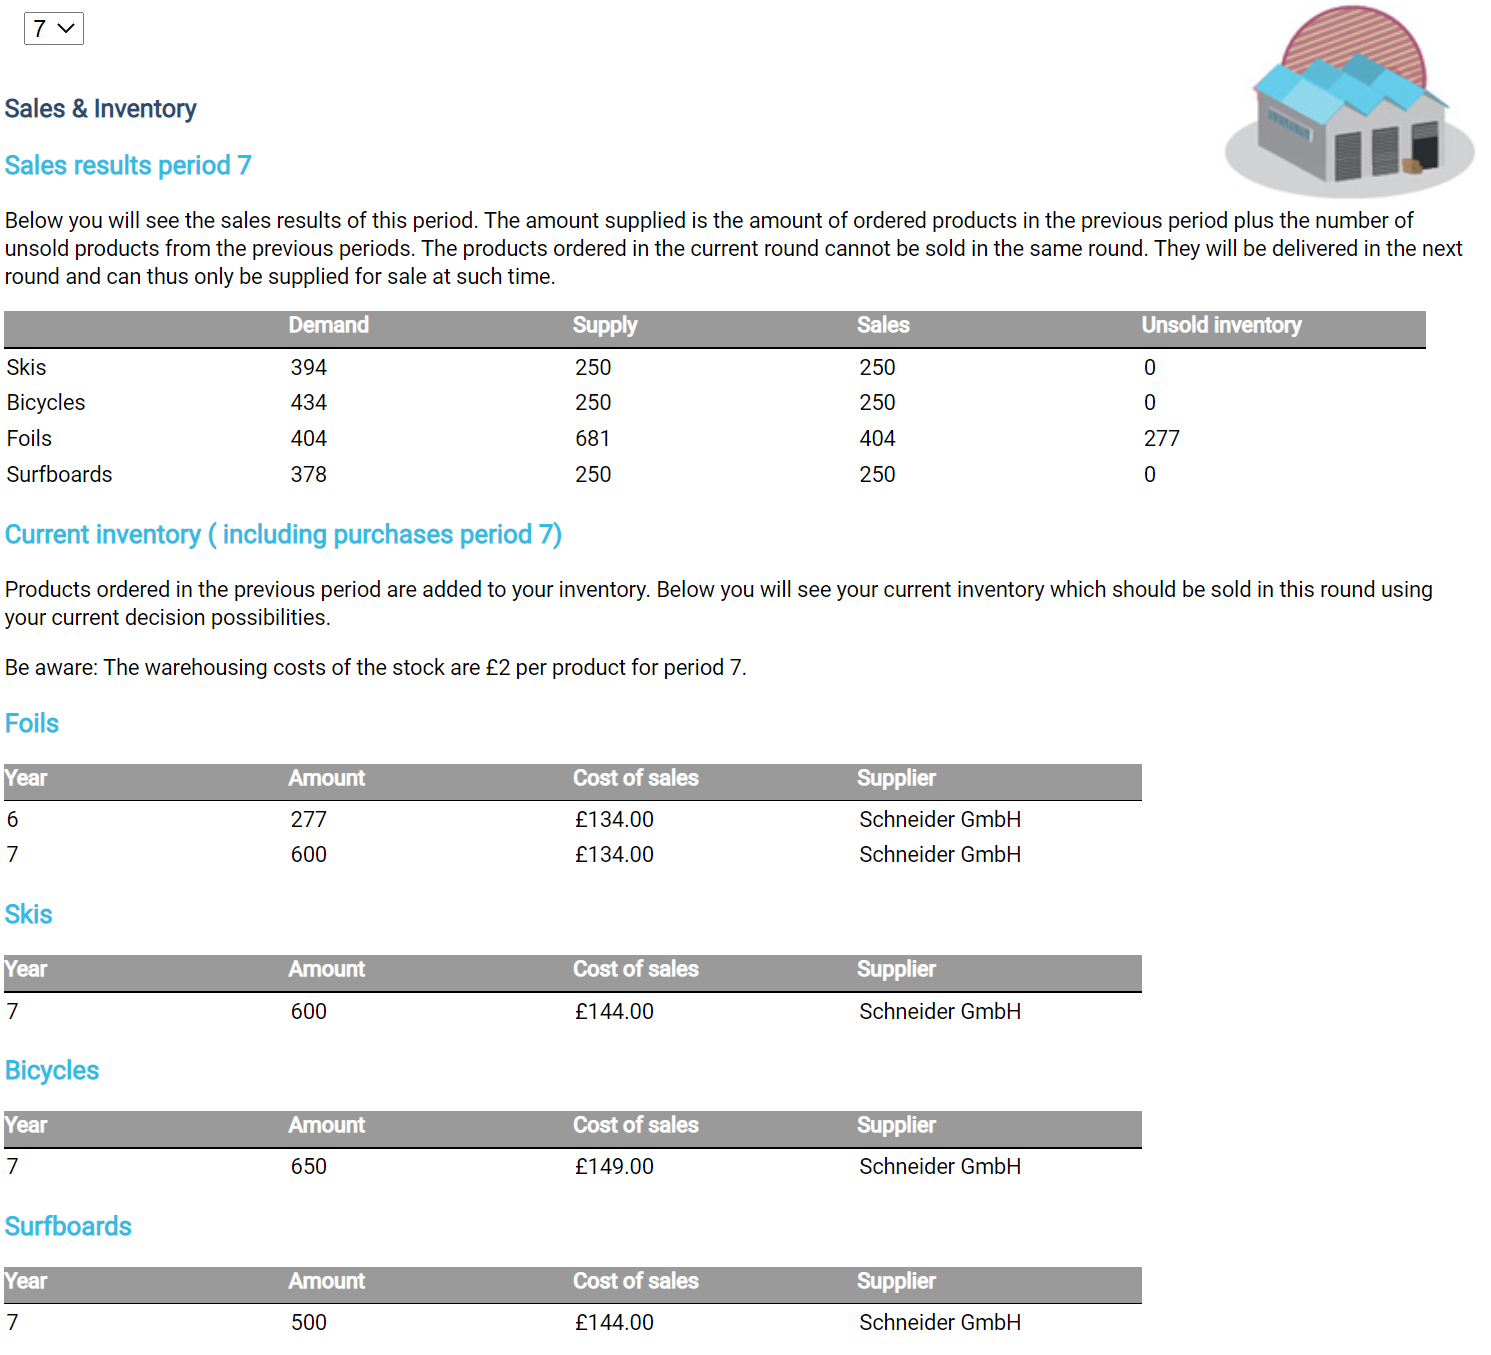
As as you can see in the tables below you can see your current inventory and the sales and demand (found in results -> inventory). The top table is the one that you should not really be looking at when you are making purchasing orders but instead the bottom one.
When you make an order for example before the round calculation, the order will not arrive till the end of the round, and will only be in your inventory at the end of the round, therefore cannot be used in the current calculation. Instead it will be used in the next calculation. As you can see in the current inventory table you can see the orders that you have placed, and will be used in the next calculation and not this one.
So when you place an order it will not be used in the current round calculation but the next one.
It is rather difficult to increase the scores for staff motivation and loyalty in the balanced scorecard. It will take time and resources for the metrics to increase.
However in order to increase these metrics you need to go to the HRM decisions. Once selected, a training and working conditions budget of "good" and above will help slowly increase motivation and loyalty. However, another important metric is the wages that you set for your sales representatives, where we would recommend a salary of at least 2000 a month, whereby the higher the amount that you set the greater amount of motivation and loyalty you will receive.
If you are struggling with where you are meant to start with the simulation. Take a look at our instructional video that will guide as to where you can begin and what elements you should focus on.
Measurability – The degree to which size, purchasing power and, importantly, profits of a market segment that can be measured.
Accessibility - The degree to which a market segment can be reached and served.
Sustainability – The degree to which a market segment is sufficiently large or profitable
Actionability - The degree to which effective programmes can be designed for attracting and serving the given market segment (offline and online).
Differentiability - How 'unique' your company is based on your targeted audience. The percentage of the market that you will not serve based on your targeting.
Unfortunately all text that you write within the simulation, will not be used when calculating the simulation. Due to the range of possibilities an individual can write, it therefore means trying to translate the message into market share / results is too difficult.
However, this does not mean that you shouldn't write down in these text boxes. Your lecturer will often logon to your account to view your activity and see your justifications for your decisions. As well as your team members being able to make decisions based on these texts. Finally they are also extremely useful when writing a report/assignment based on the simulation that you may have to do at the end.
Unfortunately you are only able to change your segmentation/targeting in Q2 and Q3 of the simulation. Once Q2 and Q3 have been calculated you are no longer able to change your target group. Therefore spend some time with your team and decide on who you want to target, making all future decisions around the segments that you have selected.
.png?length=300&name=unnamed%20(11).png)
.png?length=300&name=unnamed%20(7).png)
.png?length=300&name=unnamed%20(8).png)
.png?length=300&name=unnamed%20(6).png)

.png?length=300&name=unnamed%20(10).png)
.png?length=300&name=unnamed%20(5).png)
.png?length=300&name=unnamed%20(9).png)
.png?length=300&name=unnamed%20(4).png)
.png?length=300&name=unnamed%20(2).png)
.png?length=300&name=unnamed%20(1).png)
.png?length=300&name=unnamed%20(3).png)
.jpg?length=300&name=unnamed%20(2).jpg)


.png?length=300&name=loughborough-university-logo%20(small).png)


 Management simulation
 Edubook
application recieved
We have received your question and we will return to you within 24 hours on workdays.